
Most HR leaders walk into budget season with headcount requests and turnover data. They walk out having justified their existence rather than proven their value.
The Metric Nobody Was Tracking
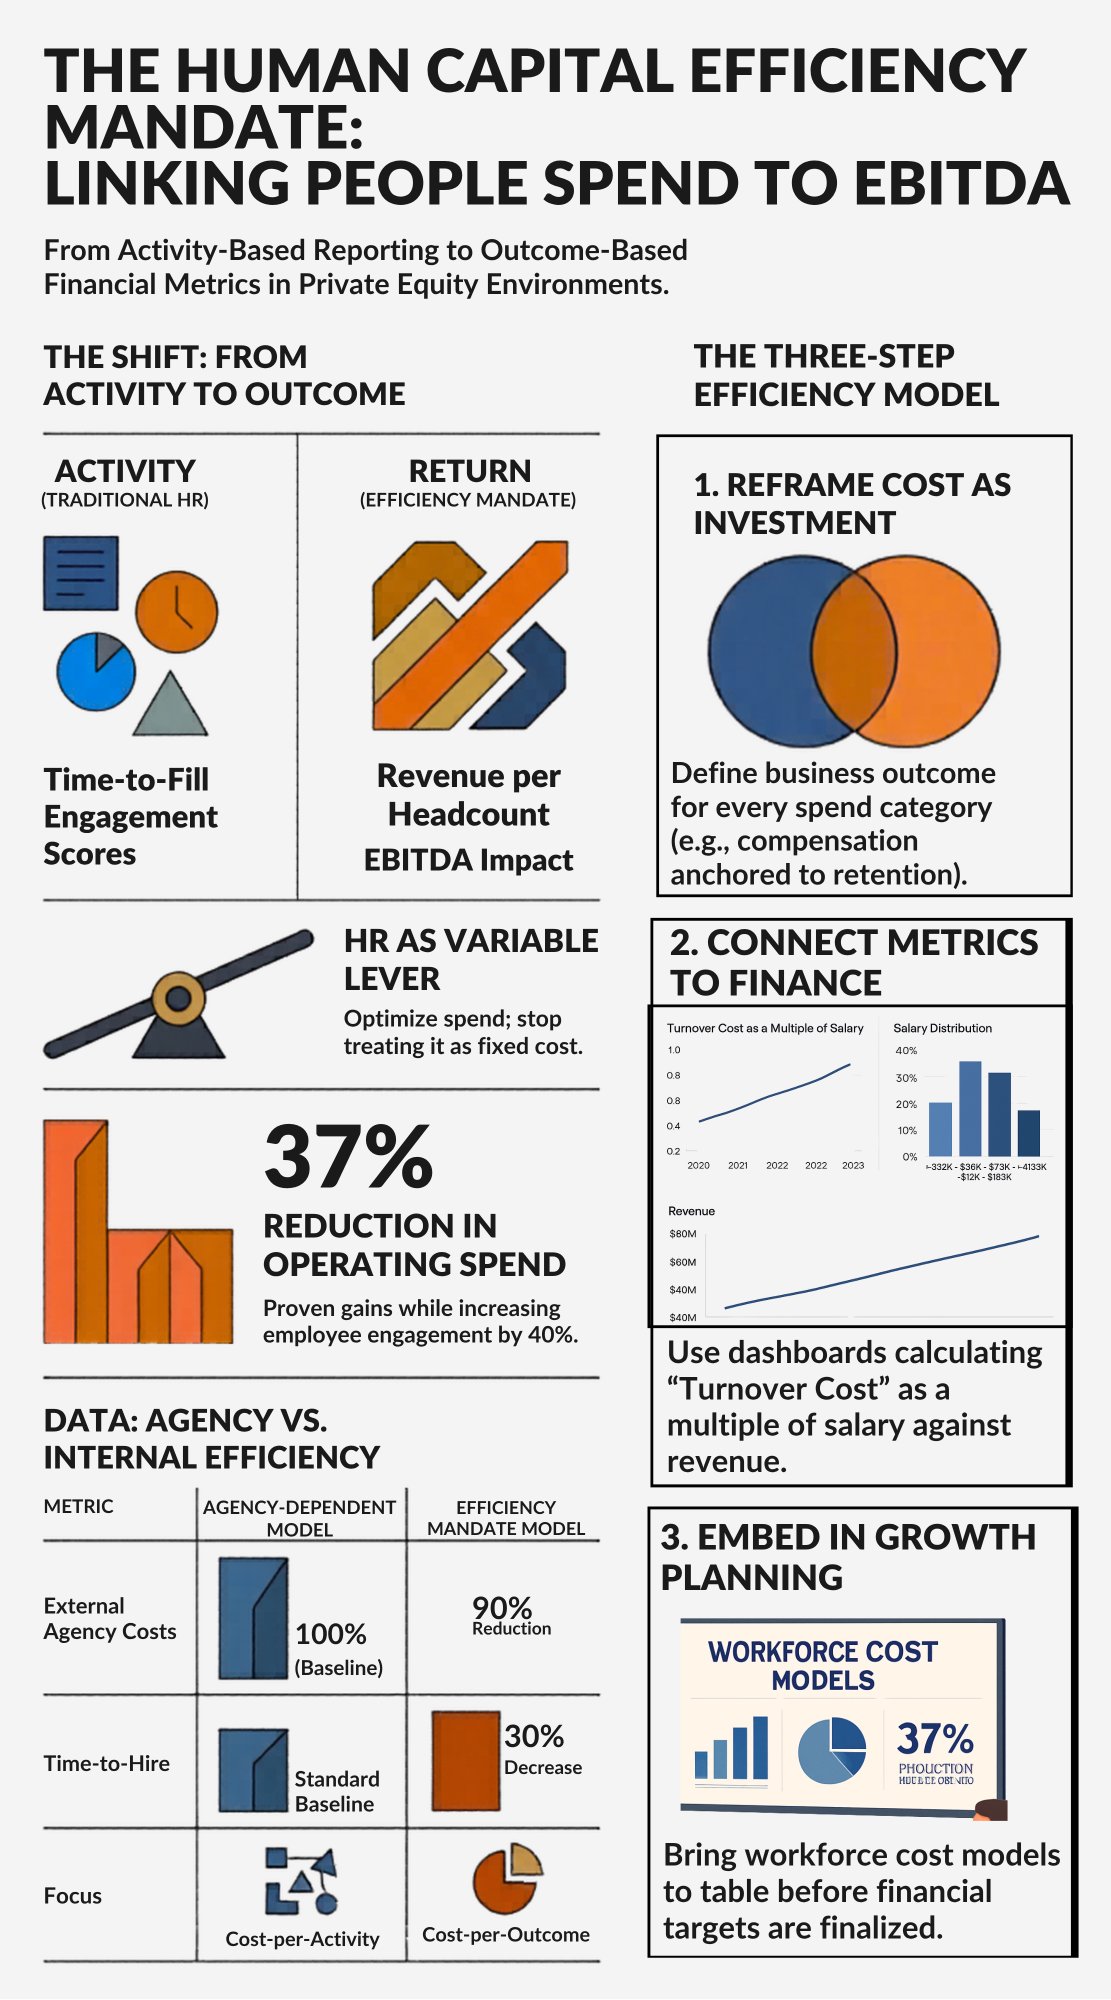
I have sat in enough PE board reviews to know what happens when the people function shows up with engagement scores and time-to-fill charts. The room tolerates it. Nobody acts on it. The CFO moves to the next slide.
The conversation has shifted. PE operating partners and CFOs are not asking whether employees are engaged. They are asking what each dollar of people spend is returning in revenue, margin and enterprise value. Revenue per headcount. HR operating cost as a percentage of total operating expense. EBITDA impact per integration. These are the metrics that determine whether HR gets a seat at the deal table or a seat in the hallway.
The Human Capital Efficiency Mandate is not a framework. It is a pressure test. And most HR functions are failing it because they are measuring the wrong things.
Why the Standard HR Budget Conversation Fails
The standard approach treats HR spend as a fixed cost to be minimized rather than a variable lever to be optimized. Headcount gets approved or denied based on span of control ratios and industry benchmarks. Benefits costs get reviewed annually with a shrug and a renewal. Recruiting spend gets scrutinized only when a CFO notices the agency fees.
The problem is not the spending. The problem is the absence of a return calculation attached to any of it.
When HR cannot answer “what did we get for that,” the default answer from the business is “less.” Cut the recruiting budget. Freeze headcount. Defer the HRIS upgrade. Every one of those decisions looks rational in isolation. In aggregate, they hollow out the people function at exactly the moment the business needs it to perform.
I have seen this pattern across PE-backed companies at every stage of the growth curve. The organizations that avoided it shared one trait: the HR leader came to every conversation with a cost-per-outcome figure, not a cost-per-activity figure. The distinction matters more than most HR professionals realize.
What the Numbers Actually Show
At one company, I inherited a talent function that ran almost entirely on external agency spend. The cost was not just the fee percentage. It was the compounding drag on time-to-hire, on quality consistency and on internal capability that never got built. By eliminating that dependency, we cut external agency costs 90% while reducing time-to-hire 30%. That is not an HR win. That is an operating margin improvement.
The clearest example came at a global organization where I drove a 37% reduction in HR operating spend while simultaneously delivering a 40% improvement in engagement and scaling from 12 to over 1,200 employees. The reduction did not come from cutting programs. It came from building systems that scaled without adding headcount to HR. Every dollar saved in HR administration went back into talent investment where it produced measurable return.
These are not exceptional outcomes. They are what happens when HR stops reporting activity and starts reporting return.
Three Steps to Build a Human Capital Efficiency Model
1. Reframe every HR cost as an investment with an expected return.
Start with your three largest people spend categories. For most companies that is compensation, benefits and recruiting. For each one, define the business outcome it is supposed to produce and the metric that proves it. Compensation anchored to retention targets. Benefits spend benchmarked against turnover cost. Recruiting investment measured against quality-of-hire and time-to-productivity. If you cannot define the return, you cannot defend the spend, and you will not be invited to the conversation where spending decisions get made.
2. Build an executive dashboard that connects people metrics to financial outcomes.
Turnover rate means nothing in isolation. Turnover cost, calculated as a multiple of salary and factored against your revenue per headcount, is a number a CFO will respond to. Build the dashboard that makes that connection explicit. Track hiring velocity against revenue targets. Track HR operating cost as a percentage of total operating expense over time. Show the trend, not just the snapshot. This is the language that moves HR from a support function to a business function.
3. Embed human capital metrics into the deal and growth planning cycle.
If you are in a PE-backed company, HR needs to be present before the budget is set, not after. That means bringing workforce cost models to the growth planning conversation, not the headcount approval conversation. It means showing how people infrastructure investment in Q1 produces operating leverage by Q3. I covered this in more detail in The Hidden Cost Curve in Private Equity Backed Hypergrowth, but the core principle is simple: if HR shows up after financial targets are set, HR is always justifying rather than shaping.
If you are navigating this right now, let’s compare notes. I am currently opening conversations for my next fractional or full-time leadership role.